

Heatmap & User Recording: How to See Visitors Using Your Website
You launched your website, added a clear call-to-action, and started getting traffic. But one question remains: what are visitors actually doing on your site? Are they noticing your main button? Are they reading your key offer? Or are they getting confused and leaving?
This is where a heatmap website tool becomes incredibly useful. Instead of guessing, you can see how people interact with your pages through clicks, scrolling behavior, mouse movement, and even session recordings.
For business owners, this is one of the easiest ways to improve UX using real data. You do not need to be a full-time analyst. You just need to know what to look for and how to turn insights into action.
What Is a Heatmap Website Tool?
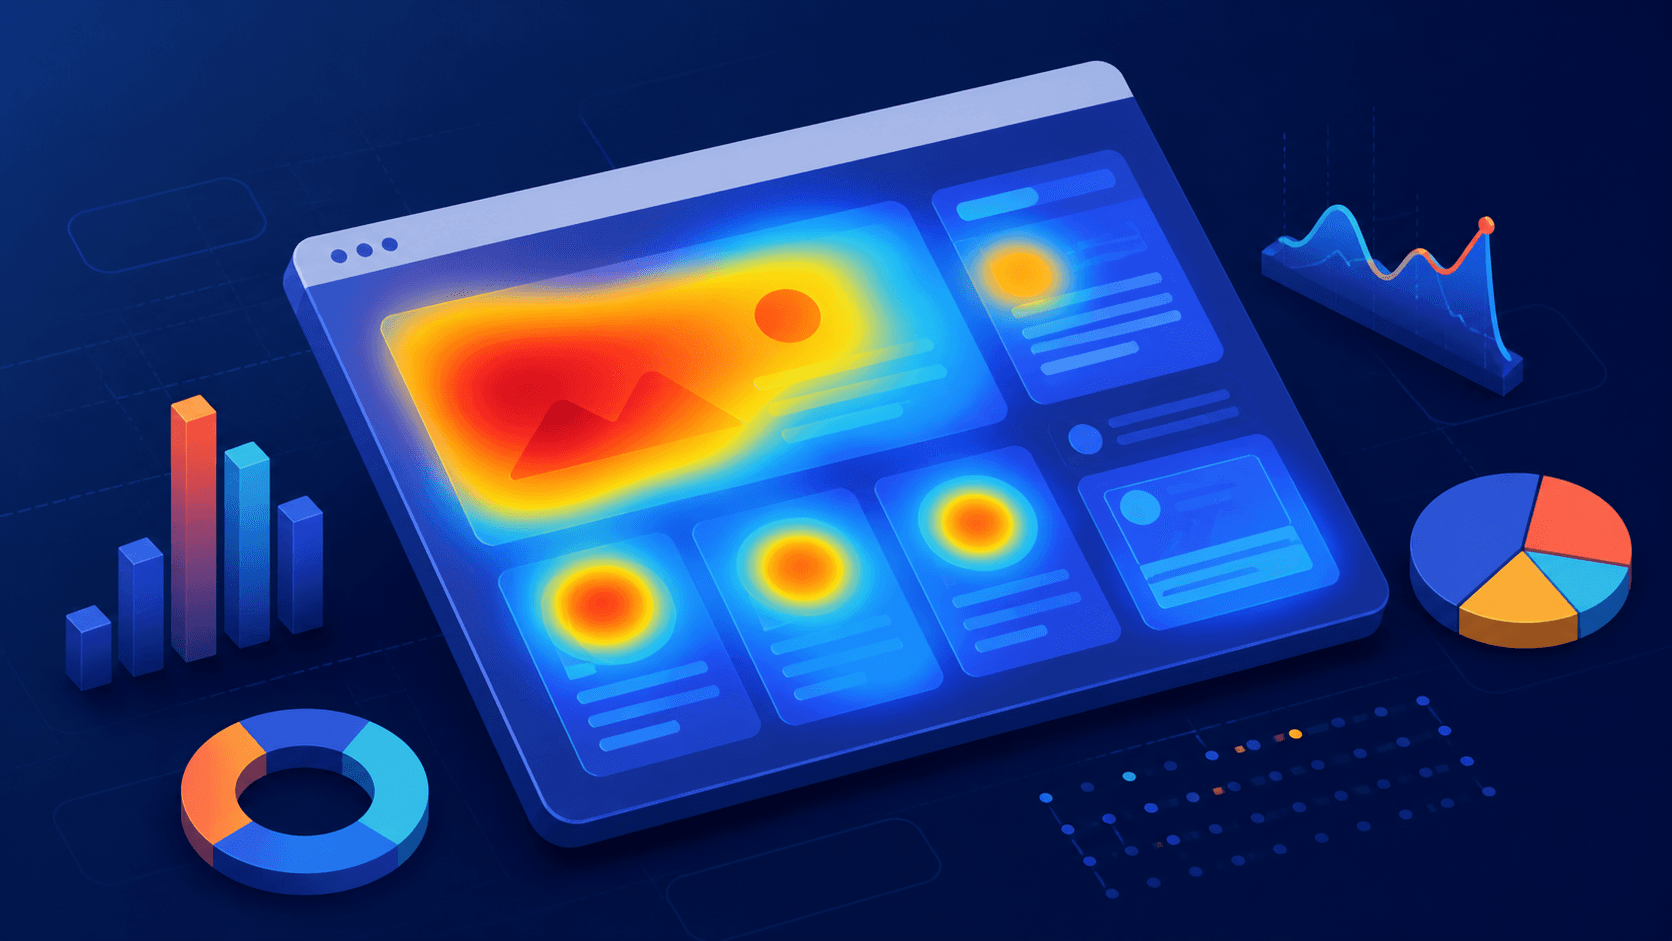
A heatmap website tool is a visual analytics tool that shows where users interact most on your website. It translates behavior into colors, making it easier to spot patterns quickly.
In most cases, warmer colors like red, orange, or yellow show high activity, while cooler colors show lower activity.
There are three common types of heatmaps:
Click Heatmap
A click heatmap shows where users click on a page. This is especially useful for identifying:
- Whether visitors click your main CTA button n- Whether they click non-clickable elements by mistake
- Which links or menu items get the most attention
- Whether important actions are being ignored
For example, if your "Contact Us" or "Get a Quote" button receives very few clicks, that usually signals a problem. The issue may be:
- Weak visual hierarchy
- Poor button placement
- Unclear copy
- Too many competing elements on the page
In short, if visitors are not clicking the action you want, your page may not be guiding them well enough.
Scroll Heatmap
A scroll heatmap shows how far users scroll down a page. This helps you understand whether your content is engaging enough to keep attention.
If most visitors only reach 30% of the page, that is a strong sign that:
- The opening section is not compelling
- The page is too long or hard to scan
- Important information is placed too far down
- The content does not match user intent
This insight is very valuable for landing pages, service pages, and long-form content. If people are dropping off early, your most important message may never be seen.
Mouse Movement Heatmap
A mouse movement heatmap tracks where users move their cursor. While it is not a perfect measure of attention, it often gives clues about what people are looking at or considering.
It can help you identify:
- Areas that attract interest
- Sections where users hesitate
- Elements that appear interactive even when they are not
Used together with click and scroll heatmaps, mouse movement data can help you understand how users navigate visually through a page.
What Is Session Recording?
Session recording, also called user recording, lets you watch real browsing sessions from actual visitors. You can see:
- Where they move their mouse
- What they click
- How they scroll
- Where they hesitate
- When they leave
Think of it as watching a replay of someone using your website.
This is powerful because heatmaps show aggregated patterns, while session recordings show individual behavior. A heatmap may tell you that users are not clicking your button. A recording may reveal why: maybe a popup blocks the page, maybe the button is too low, or maybe users get distracted by another element.
For business owners, session recording is one of the fastest ways to spot UX friction without running a full usability test.
Best Tools for Heatmaps and User Recordings
There are many tools on the market, but these three are among the most popular and practical for small to mid-sized businesses.
Hotjar
Hotjar is one of the best-known tools for heatmaps and user behavior analytics. It offers:
- Click, scroll, and move heatmaps
- Session recordings
- Feedback widgets
- Surveys and user insights tools
Hotjar is user-friendly and great for teams that want both quantitative and qualitative data in one platform.
Microsoft Clarity
Microsoft Clarity is a strong option if you want a free tool with solid features. It includes:
- Heatmaps
- Session recordings
- Rage click detection
- Dead click detection
- Quick setup
For many business owners, Clarity is the easiest place to start because it costs nothing and still gives meaningful UX insights.
Mouseflow
Mouseflow is another popular platform focused on behavior analytics. It offers:
- Heatmaps
- Session replay
- Funnel analysis
- Form analytics
Mouseflow can be especially useful if you want to dig deeper into conversion paths and form performance.
How to Read Heatmap Data the Right Way
Installing a heatmap website tool is easy. The real value comes from knowing how to interpret the data.
If Visitors Do Not Click Important Buttons
If your main CTA is getting ignored, do not assume users are lazy. Usually, the page is not communicating clearly enough.
Check these areas:
- Is the button visually prominent?
- Is the copy specific and action-oriented?
- Is the CTA placed too low?
- Are there too many distractions nearby?
- Does the surrounding content build enough trust?
A low-click CTA often means a problem with hierarchy, layout, or copywriting.
If Users Click the Wrong Things
Sometimes users click on images, headings, or icons that are not actually clickable. This usually means your design is sending the wrong signal.
When that happens, you can:
- Make the element clickable if it makes sense
- Redesign it so it does not look interactive
- Add clearer labels or buttons
This is a simple way to reduce confusion and improve usability.
If Most Visitors Only Scroll 30%
This is one of the most common issues on service pages and landing pages. If users stop early, your content may not be engaging enough.
Possible fixes include:
- Improve the headline and opening copy
- Add stronger visuals
- Break text into shorter sections
- Move key information higher on the page
- Match the content more closely to search intent
If people do not scroll, they are not seeing your full message. That means your page is losing opportunities before the offer even appears.
Use Recordings to Confirm the Story
Always pair heatmaps with session recordings. A heatmap shows a pattern, but recordings help explain the reason behind it.
For example:
- Heatmap: low CTA clicks
- Recording insight: users pause on pricing, then leave
Or:
- Heatmap: low scroll depth
- Recording insight: visitors bounce after a slow-loading hero section
This combination helps you avoid making random design changes.
How to Install Microsoft Clarity Step by Step
If you want a free and practical way to start, Microsoft Clarity is a great choice. Here is how to set it up.
1. Create a Microsoft Clarity Account
Go to the Microsoft Clarity website and sign in using a Microsoft, Google, or Facebook account. Once logged in, click to create a new project.
2. Add Your Website Project
Enter:
- Your project name
- Your website URL
- Your website category if requested
After that, Clarity will generate a tracking code for your site.
3. Install the Tracking Code
You have a few options depending on how your website is built.
Option A: Add the Script Manually
Copy the Clarity tracking script and paste it inside the <head> section of your website.
If you use a custom-coded website, your developer can do this quickly.
Option B: Use Google Tag Manager
If your site already uses Google Tag Manager, this is often the easiest option.
Steps:
- Open Google Tag Manager
- Create a new tag
- Choose Custom HTML
- Paste the Microsoft Clarity script
- Set the trigger to All Pages
- Save and publish
Option C: Use a CMS Plugin or Theme Integration
If your website runs on WordPress or another CMS, you may be able to add the script through:
- A header/footer plugin
- Theme settings
- A tag manager plugin
4. Verify Installation
Return to Microsoft Clarity and check whether your project is receiving data. It may take a short time before visits appear.
Once active, Clarity will begin collecting:
- Session recordings
- Heatmaps
- Click patterns
- Scroll data
5. Let the Data Build Up
Do not rush to conclusions after a few visits. Let the tool collect enough sessions so you can identify patterns.
As a starting point, review:
- Your homepage
- Main service pages
- Landing pages
- Contact page
These pages usually have the biggest impact on conversions.
6. Review and Take Action
After a few days or weeks, start looking for patterns such as:
- Important buttons being ignored
- Users dropping off before key content
- Repeated clicks on non-clickable elements
- Friction in forms or navigation
Then test improvements one by one. For example:
- Move the CTA higher
- Rewrite the headline
- Shorten the hero section
- Simplify the layout
- Improve mobile usability
The goal is not just to collect data. The goal is to improve the user experience and increase conversions.
Turn User Behavior Into Better UX Decisions
A heatmap website tool helps you move beyond assumptions. Instead of asking, "Why is this page not converting?" you can start seeing what users actually do.
Heatmaps reveal attention patterns. Session recordings reveal friction. Together, they give business owners a practical way to improve website performance using real behavior data.
If visitors are not clicking your important button, that points to a hierarchy or copy issue. If they only scroll 30%, your content may not be engaging enough. These are not just interesting observations. They are actionable UX insights.
If you want a better-performing website, start by observing users before redesigning blindly.
And if you need help turning those insights into a faster, clearer, and more conversion-focused website, kreasikita.co can help you design and develop a site that works better for real users.